Avaya 75940X Exam Questions
Questions for the 75940X were updated on : Apr 19 ,2025
Page 1 out of 5. Viewing questions 1-15 out of 64
Question 1
A new ESXi host has been added to the ACP 4200. However, unlike existing ESXi hosts within the ACP
4200, the new host cannot be monitored or detected by Avaya Orchestrator.
What is causing this problem?
- A. The new host has not been correctly configured to support vMotion.
- B. The new host has not been added to Avaya Orchestrator.
- C. The new host has not been licensed yet.
- D. The new host has not been configured for Auto Detection.
Answer:
B
Question 2
Refer to the exhibit.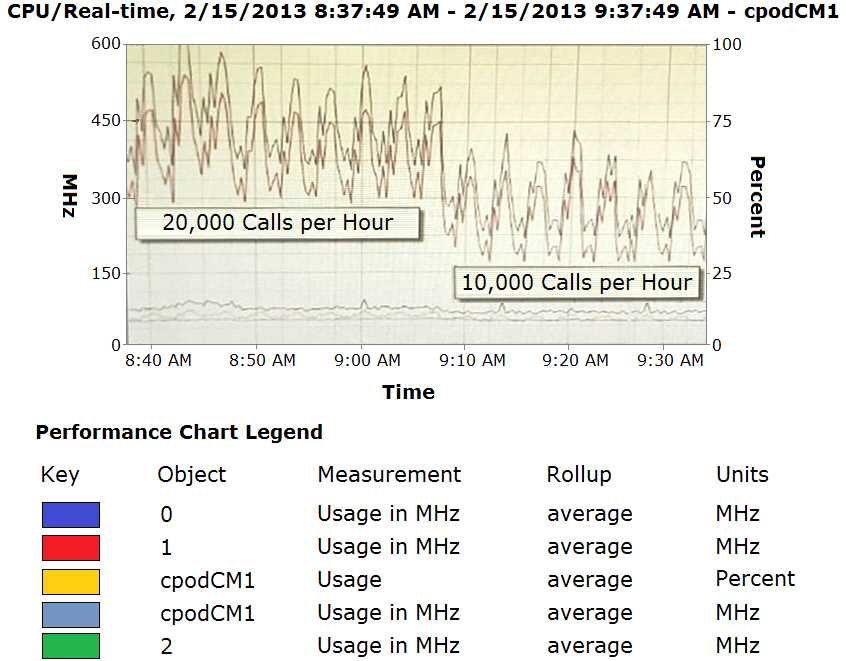
The CPU performance of Communication Manager (CM) shows a significant difference depending on
the call rates.
Which statement about making configuration changes is true?
- A. Increasing the number of Virtual CPUs allocated to CM might help to reduce this difference.
- B. Ensuring that a secondary CM is available to allow for load-balancing might help to reduce this difference.
- C. Migrating the CM Virtual Machine to another ESXi host that is less busy might help to reduce this difference.
- D. Reducing this difference is not necessary because this is expected behavior.
Answer:
B
Question 3
With ACP 4200, what is mandatory to ensure Avaya Aura High Availability across the two Data
Centers?
- A. A single vCenter Server that manages both Data Centers.
- B. Network connectivity to and in between the two Data Centers.
- C. Identical compute servers in both Data Centers.
- D. The same VLANs in both Data Centers.
Answer:
A
Reference:
https://downloads.avaya.com/css/P8/documents/101054952
(9)
Question 4
Refer to the exhibit.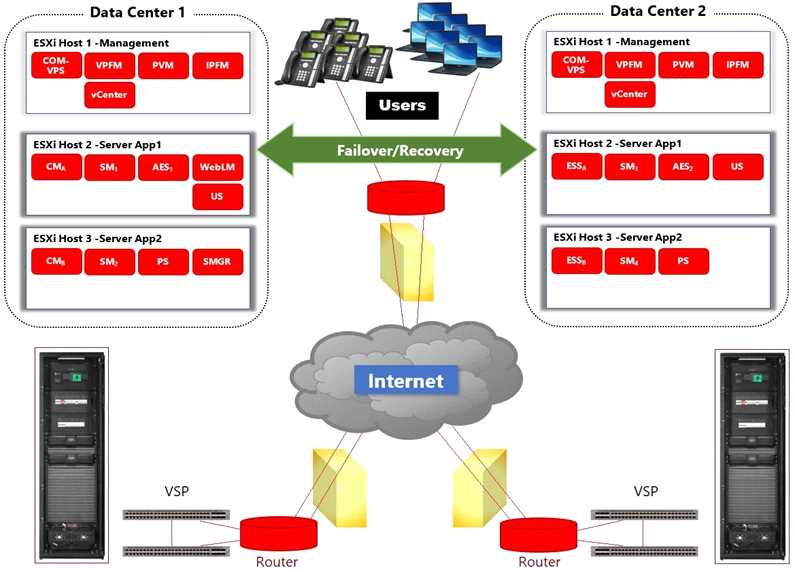
In the deployment shown in the exhibit, how is High Availability achieved across the two Data
Centers?
- A. By ensuring that the L2 VLANs are extended across to both Data Centers.
- B. By managing both Data Centers using the same vCenter Server and using vMotion and DRS.
- C. By using Virtualization Provisioning Service (VPS) to automate the provisioning of the network hardware and vSwitches across the two Data Centers.
- D. By using Avaya Aura® Application High Availability features.
Answer:
C
Reference:
https://downloads.avaya.com/css/P8/documents/100182353
Question 5
Which two circumstances would require the Avaya Orchestrator ACP Configuration Wizard to be run
in the field? (Choose two.)
- A. When a new G450 Gateway is added to the ACP.
- B. When a new configuration file for the ACP's VSP Switches is deployed.
- C. When a new Virtual Machine is added to the ACP.
- D. When a new ESXi Host is added to the ACP.
Answer:
BD
Reference:
https://downloads.avaya.com/css/P8/documents/101061680
Question 6
How would an administrator display the IP addresses of the VSP switches of the ACP 4200 within the
Avaya Orchestrator Home Dashboard?
- A. By right-clicking on the Dashboard menu item and downloading the network summary report.
- B. By right-clicking on the Admin menu item and downloading the network summary report.
- C. By right-clicking on the Report menu item and downloading the network summary report.
- D. By hovering the mouse pointer over the Up status indicator within the Network dashlet.
Answer:
B
Question 7
An administrator needs to access Avaya Orchestrator.
How does an administrator log into the management interface of Avaya Orchestrator?
- A. By using a browser to login to System Manager, then clicking on the Avaya Orchestrator link.
- B. By using a browser to login to Avaya Orchestrator's FQDN or IP address.
- C. By downloading and using the System Manager Administrator client.
- D. By downloading and using the Avaya Orchestrator Administrator client.
Answer:
B
Reference:
https://downloads.avaya.com/css/P8/documents/101061680
Question 8
Refer to the exhibit.
An administrator is adding new equipment to the ACP 4200 in the Avaya Orchestrator Configuration
Wizard. How do the Device Description and Serial Number fields get populated in the Avaya
Orchestrator
Configuration Wizard?
- A. These are optional fields that do not need to be populated.
- B. These are automatically detected by clicking on the Detect Hardware button.
- C. These are manually entered by the administrator.
- D. These are imported from the ACP Configurator Tool Excel spreadsheet.
Answer:
C
Reference:
https://downloads.avaya.com/css/P8/documents/101061680
(50)
Question 9
An Avaya Orchestrator administrator is asked to check the CPU usage for the last 24 hours of one of
the ESXi Hosts, as it has been performing erratically.
How can the administrator go about doing this?
- A. By clicking on the Compute Group's Service State line.
- B. By navigating to Quick View – All Host Problems.
- C. By going to the Performance Graphs of the CPU Usage Service for the host.
- D. By selecting the VM Group's Service State line.
Answer:
A
Reference:
https://downloads.avaya.com/css/P8/documents/101061680
(135)
Question 10
An administrator is adding new equipment to the ACP 4200 in the Avaya Orchestrator Configuration
Wizard.
How do the IP Address and Protocols fields get populated?
- A. These are optional fields that do not need to be populated.
- B. These are automatically detected by clicking on the Detect Hardware button.
- C. These are manually entered by the administrator.
- D. These are imported from the ACP Configurator Tool Excel spreadsheet.
Answer:
B
Reference:
https://downloads.avaya.com/css/P8/documents/101061680
Question 11
Refer to the exhibit.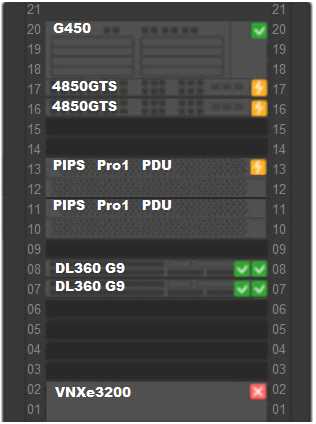
An administrator navigates to the Avaya Orchestrator page shown in the exhibit. The 4850GTS
switches and the PIPS Pro1 PDUs are displaying an Orange status icon.
What does this indicate?
- A. These devices have not been configured with correct credentials.
- B. These devices have power supply issues.
- C. These devices have services with status of warning.
- D. These devices have reachability issues.
Answer:
C
Reference:
https://downloads.avaya.com/css/P8/documents/101061680
(140)
Question 12
Avaya Orchestrator monitors the ACP 4200 components by organizing them into which two groups?
(Choose two.)
- A. Power
- B. Virtual Machines
- C. Storage
- D. Applications
Answer:
AC
Reference:
https://downloads.avaya.com/css/P8/documents/101061680
(130)
Question 13
Refer to the exhibit.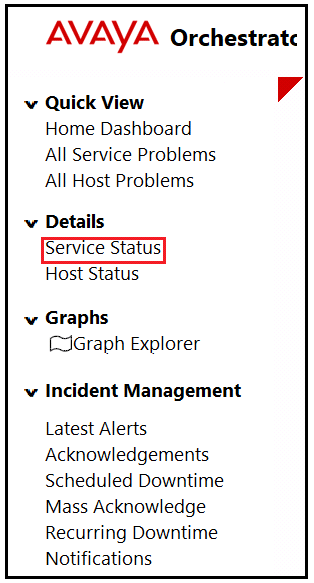
An administrator navigates to the Avaya Orchestrator link shown in the exhibit. What would the
Administrator be able to monitor here?
- A. A list of Services with status of Warning or Critical.
- B. A list of Services with status of OK.
- C. A list of Services regardless of status.
- D. A list of Services which have additional details.
Answer:
D
Reference:
https://downloads.avaya.com/css/P8/documents/101061680
Question 14
An Avaya Orchestrator administrator has been tasked with getting a copy of the Temperature Values
chart for a Server. When doing this in the past, the administrator has navigated to the Compute
Group Dashlet-Host
Up-Host IP Address-Performance Chart. However, the Temperatures Values chart cannot be found.
What is potentially causing this issue?
- A. The SNMP credentials for the Server's thermostats subsystems are incorrect.
- B. The IP address chosen is of the ESXi host, not the iLO interface.
- C. The Host is currently unresponsive.
- D. The Temperatures Values are only available for VSP switches and Storage systems.
Answer:
C
Question 15
Refer to the exhibit.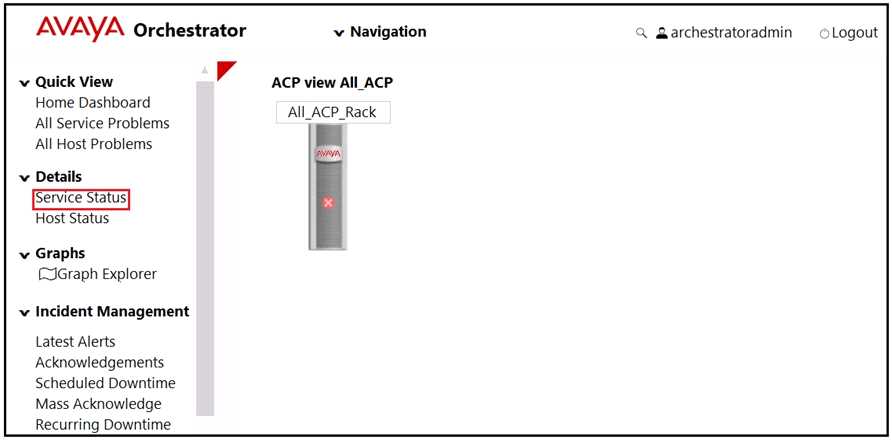
An administrator notices that the Rack View of Avaya Orchestrator is highlighted with a Red X on the
graphical representation of the rack.
What does this indicate?
- A. At least 50% of the hosts in the rack contain a service which is in critical state.
- B. The rack has a front door that is currently unlocked.
- C. The rack is currently unreachable.
- D. At least one of the hosts in the rack contains a service which is in critical state.
Answer:
D
Reference:
https://downloads.avaya.com/css/P8/documents/101061680
(16)